Wearables Measure Signals Before They Measure Health
A wearable device does not directly see heart rate, sleep quality, stress, blood oxygen, or energy burned. It observes physical signals that change with the body: reflected light from blood flow, tiny electrical voltages from the heart or skin, motion from the wrist, skin temperature shifts, and sometimes pressure or bioimpedance. The device samples those signals many times per second, cleans up the messy parts, compares patterns against calibration data, and turns the result into a reading that looks simple on screen. That number is the end of a chain. A sensor creates a raw trace, analog electronics amplify it, an analog-to-digital converter turns it into data, and firmware decides which parts are likely body signal rather than movement, poor contact, sweat, ambient light, or loose fit. Understanding that chain makes wearable metrics easier to interpret. The watch or ring is not a lab instrument floating above daily life. It is a compact signal-processing system trying to measure a living, moving body from a difficult position on the skin.
A: Most estimate heart rate by detecting repeating blood-flow or electrical patterns, then converting intervals between peaks into beats per minute.
A: Green light is strongly affected by shallow blood-volume changes, which helps wrist devices find pulse patterns during everyday wear.
A: It tracks movement so algorithms can classify activity and reduce mistakes caused by motion that looks similar to pulse changes.
A: The algorithm may need several clean samples before it trusts a new pattern, especially when motion and heart rate change quickly.
A: No. Skin temperature is influenced by circulation, room conditions, and device placement, so wearables usually interpret trends instead.
A: The device compares red and infrared light absorption patterns, then applies calibration models to estimate blood oxygen saturation.
A: Fit controls how stable the light path, electrode contact, and motion coupling are between the sensor and the body.
A: No. Brands use different sensors, sampling rates, filters, validation data, and rules for smoothing or hiding uncertain results.
A: It is the process of identifying data segments distorted by movement, contact loss, or external interference before calculating metrics.
A: Trends average across more context, while one reading can be skewed by fit, motion, temperature, or temporary signal noise.
The Sensor Stack Inside a Wearable
Most wearable biometric systems combine several sensors because no single signal explains the body reliably. An optical heart-rate sensor may see pulse while the accelerometer sees running cadence, the temperature sensor sees cooling skin, and an electrode sees whether skin contact is stable. The device fuses these streams so each one can correct or explain the others.
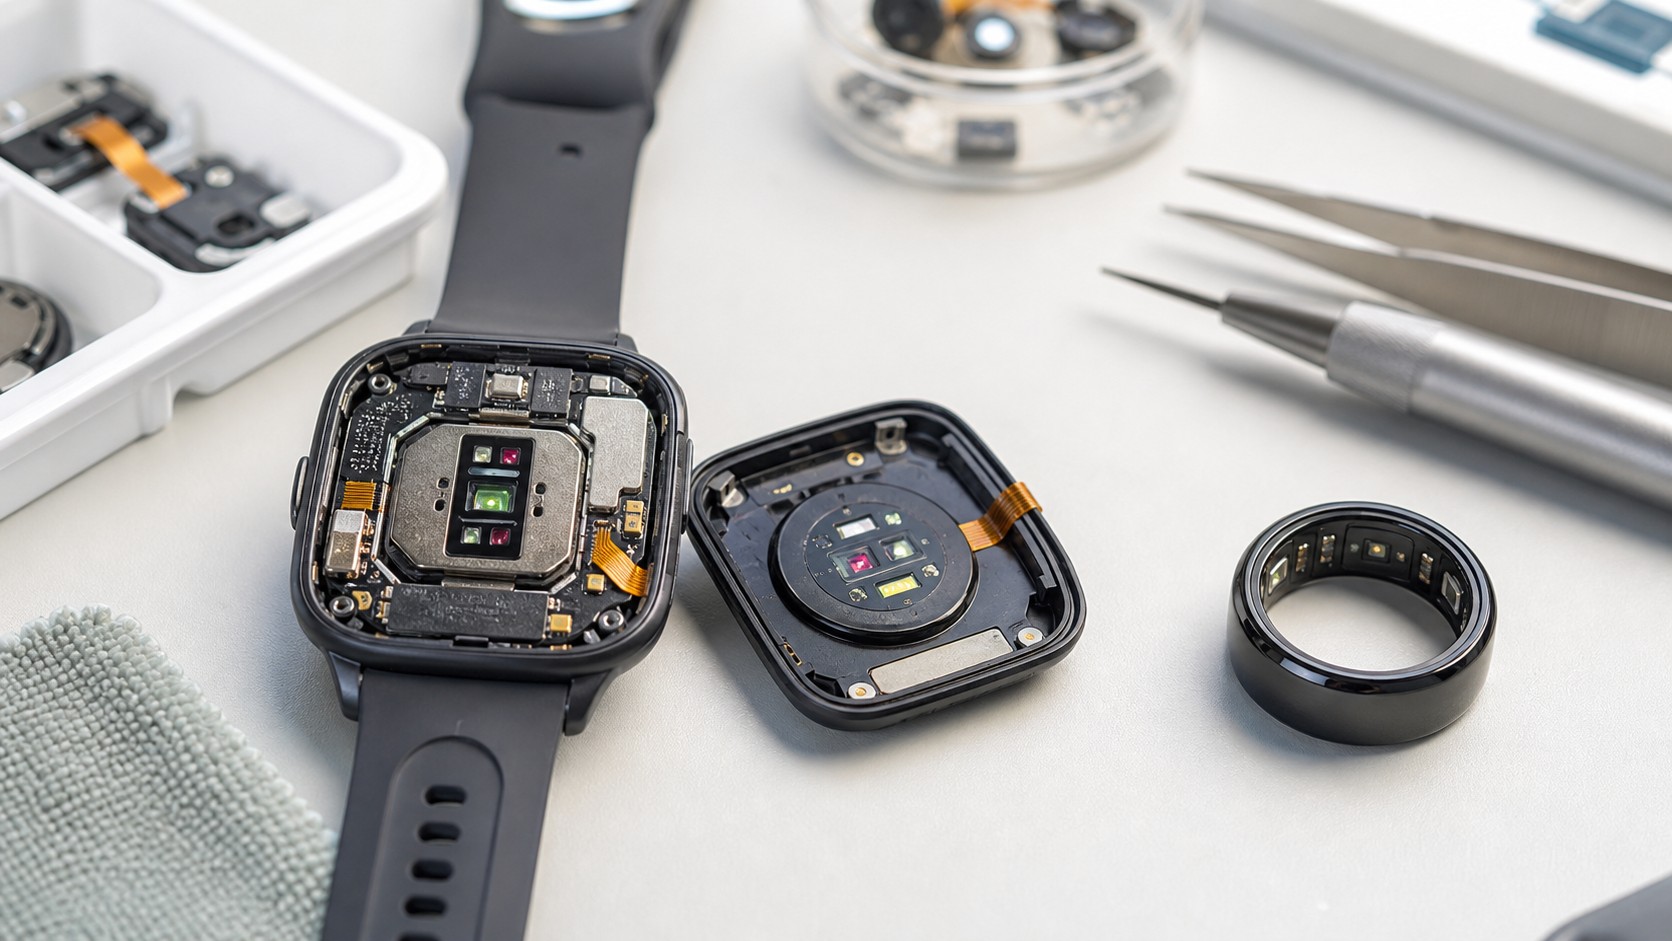
The process starts at the sensor window. LEDs, photodiodes, electrodes, thermistors, accelerometers, and gyroscopes sit close to the skin or inside the device body. Their readings are weak, noisy, and context dependent. A smartwatch must make sense of them while the wearer types, sleeps, sweats, drives, lifts weights, and shifts the band on the wrist.
Inside the casing, the sensor stack is arranged around tradeoffs. Stronger LEDs can improve optical visibility but use more power and can create heat. More frequent sampling can capture fast changes but drains the battery. A tighter strap can stabilize contact but may be uncomfortable. Good wearable design is the art of collecting enough information without turning the device into something people stop wearing.
Optical Sensors: Reading Blood Flow With Light
Photoplethysmography, often shortened to PPG, is the foundation of many wearable heart-rate readings. The device shines light into the skin and measures how much returns to a photodiode. As the heart pumps, blood volume in small vessels rises and falls. Blood absorbs light differently from surrounding tissue, so the returned signal has a tiny repeating pulse wave.
Green LEDs are common for daytime heart-rate tracking because green wavelengths interact strongly with shallow blood flow and can produce a clear wrist signal. Red and infrared light penetrate differently and are often used for blood oxygen estimation, nighttime readings, or lower-power measurement modes. The device may cycle through wavelengths, adjust LED brightness, and change sampling rate based on skin contact and activity.
The raw optical trace is not a neat heartbeat line. Wrist movement changes pressure against the skin. Tendons shift. Ambient light can leak under the watch. Dark ink, hair, cold skin, and loose fit can reduce signal quality. Algorithms search for rhythmic peaks that fit plausible pulse timing while rejecting patterns that match motion instead.
Optical oxygen estimation adds another layer. Oxygenated and deoxygenated hemoglobin absorb red and infrared light differently, so the device compares the changing portions of those channels. The result depends on calibration, perfusion, stable contact, and enough clean pulse cycles. That is why many wearables take SpO2 readings while the wearer is still or asleep instead of during fast motion.
Electrical Sensors: Measuring Tiny Voltages and Conductance
Some wearables include metal electrodes that touch the skin. When placed correctly, these electrodes can measure voltage differences produced by the heart, similar in principle to an electrocardiogram, though with fewer contact points than clinical equipment. Instead of relying on blood-flow changes, electrical sensing looks closer to the timing of the heart’s own activation.
Electrical measurements are sensitive to contact quality. Dry skin, sweat, hair, muscle tension, and hand position can change the signal. That is why many devices ask the wearer to hold still or touch a second electrode with the opposite hand for an ECG-style reading. The device needs a stable path across the body before it can identify wave shapes and intervals.
Other electrical features measure skin conductance. Sweat gland activity changes how easily a small current passes across the skin. Because sweat response is affected by heat, emotion, exercise, hydration, and environment, conductance is usually interpreted with heart rate, motion, and temperature rather than treated as a standalone stress measurement.
Bioimpedance features use a controlled, weak electrical current and measure how tissue resists or shifts that current. Depending on the design, the signal can help estimate contact quality, fluid-related trends, respiration clues, or body-composition-related values. These readings are heavily model dependent because the current path changes with electrode placement, skin moisture, posture, and anatomy.
Motion Sensors: Separating Body Movement From Body Signals
Accelerometers measure changes in movement along three axes. Gyroscopes measure rotation. Together they tell the wearable whether the user is still, walking, running, cycling, sleeping, gesturing, or moving in a way that could distort other signals. Motion data also powers step counts, activity recognition, fall detection, workout classification, and sleep movement analysis.
Motion sensing improves biometric accuracy because many false readings are movement artifacts. During a run, wrist cadence can create a strong rhythm near heart-rate frequency. During strength training, gripping and muscle contraction can disrupt blood flow under the sensor. By comparing optical pulse candidates with motion patterns, the algorithm can decide which signal is more likely to represent circulation.
Motion sensors also help conserve power. A device can sample gently during quiet periods, then increase measurement frequency during workouts or irregular movement. That adaptive behavior keeps battery drain lower while preserving more detail when the context becomes difficult.
For sleep and recovery features, motion is often used in the opposite way. Long still periods support the idea that the wearer is resting, while small movement bursts can mark awakenings or restlessness. The device then combines that movement history with heart rhythm, breathing clues, and temperature trends to build a sleep timeline.
Temperature and Pressure: Slow Signals With Useful Context
Temperature sensors in wearables usually measure skin temperature near the device, not internal body temperature. Skin temperature changes with room temperature, blood vessel constriction, sleep state, exercise recovery, fever, menstrual cycle patterns, and how tightly the wearable sits. A single value can be misleading, but overnight trends and deviations from personal baseline can be useful context.
Pressure and contact sensing are less visible to users but important to data quality. Some devices infer pressure from optical signal strength, impedance, or mechanical sensors. If the device knows the sensor is lifting from the skin, it can withhold a reading, increase LED brightness, or mark the segment as low confidence.
Temperature also helps explain other sensors. Cold fingers or wrists often have weaker peripheral blood flow, which can make optical pulse readings harder. Heat and sweat can improve some contact paths while making electrodes noisier. A context signal does not need to produce a headline metric to improve the interpretation of nearby measurements.
From Analog Waveform to Digital Metric
Every biometric reading begins as an analog signal. A photodiode produces a small current. An electrode detects a tiny voltage. A thermistor changes resistance. A motion chip reports acceleration. These outputs are conditioned by analog front-end circuits that amplify useful ranges and reduce obvious interference before conversion into digital samples.
Sampling rate matters. A heart-rate sensor needs enough samples to capture pulse peaks. An ECG feature needs a higher-quality waveform to preserve timing details. Temperature can be sampled more slowly because it changes gradually. The wearable balances sampling rate, battery life, processor load, heat, and measurement quality.
Once data is digital, signal processing begins. Filters remove slow drift or high-frequency noise. Peak detectors identify repeating features. Sensor-fusion models compare channels. Confidence scoring decides whether to show a number, smooth it, delay it, or discard it. The polished reading on screen is often a filtered estimate, not the raw latest sample.
Timing alignment is critical when several sensors are involved. If motion samples and optical samples are even slightly misaligned, the device can mistake a movement artifact for a pulse feature or miss a useful correction. Wearable firmware timestamps streams, buffers short windows of data, and analyzes them together so the final metric reflects the same moment in time.
Algorithms, Calibration, and Personal Baselines
Algorithms translate features into metrics. For heart rate, they measure time between accepted pulse peaks or electrical events. For heart-rate variability, they need cleaner beat-to-beat intervals and may reject sections that are acceptable for simple heart rate. For SpO2, they compare red and infrared light behavior and apply calibration curves derived from reference measurements.
Calibration happens at multiple levels. Manufacturers calibrate sensors against known references during design and production. Firmware accounts for sensor placement, LED intensity, photodiode response, and device geometry. User profiles add context for calorie estimates, training zones, stride models, and recovery calculations.
Personal baselines make many wearable insights more useful. A resting heart rate of 58 may be normal for one person and unusual for another. A skin temperature rise of half a degree may matter more when compared with that person’s own recent nights. Modern wearable software often emphasizes deviation from baseline because absolute consumer-grade readings vary by body, fit, and environment.
Calibration is not always visible. A device may quietly learn usual sleep schedules, typical workout intensity, walking gait, resting pulse, or nightly temperature pattern. It may also reset or reinterpret baselines after firmware updates, long periods without wear, illness, travel, or major changes in activity. That moving baseline is useful, but it means the same sensor can behave differently after it has more history.
Why Readings Can Differ Between Devices
Two wearables can observe the same person and report different values because they are not measuring from identical positions with identical assumptions. A ring has a different optical path than a watch. A chest strap detects electrical activity closer to the heart. An earbud sits near rich blood flow but faces fit and motion issues of its own.
Brands also make different choices about smoothing. One device may update heart rate quickly and show more jumps. Another may average more aggressively and look calmer. Some products hide uncertain values, while others display them with less delay. These choices affect user experience as much as hardware accuracy.
Reference standards also vary by metric. Heart rate can often be checked against electrical chest straps or clinical ECG equipment. Sleep stages are harder because consumer devices infer them indirectly and clinical sleep studies use more sensors. Calories, stress, recovery, and readiness scores are even more model driven, so comparisons across brands should be treated as comparisons between interpretations.
Limits of Wearable Biometric Sensing
Wearables are strongest at trend tracking, pattern recognition, and convenient repeated measurement. They are weaker when a single reading is expected to carry medical weight without context. Poor fit, unusual physiology, arrhythmias, tattoos, low perfusion, intense movement, and environmental extremes can all reduce reliability.
Even when sensors work well, many metrics are estimates built from indirect evidence. Sleep stages are inferred from movement, heart rhythm, and sometimes temperature or oxygen data. Stress scores often combine heart-rate variability, activity, and conductance. Calories burned are modeled from movement and profile data. The device may be directionally useful without being exact.
The practical way to read wearable biometrics is to respect both the engineering and the uncertainty. Clean contact, consistent placement, and repeated measurements improve signal quality. Trends across days or weeks usually say more than an isolated number. A wearable is a compact interpreter of light, electricity, motion, and heat, translating imperfect signals into useful patterns when the conditions are good enough.